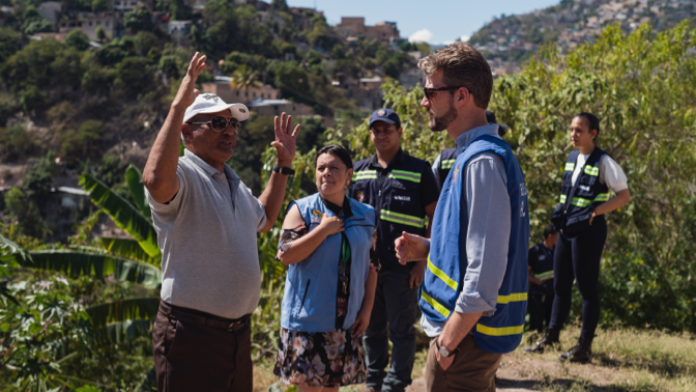
Generating positive impacts and improving living conditions as a result is the most important objective of development cooperation yet also one of its biggest challenges. After all, even though every Financial Cooperation project leads to concrete changes, the resulting impacts are not always direct and obvious. An important function of the evaluation process is therefore to examine positive and unintended negative impacts and quantify these as reliably as possible. This task is covered by the impact criterion in ex post evaluations. Past ex post evaluations are primarily based on figures and information from internal project documents, supplemented by an in-depth study of relevant literature and interviews with as many local stakeholders as possible. This method is well suited to study as many different aspects and nuances of projects as possible.
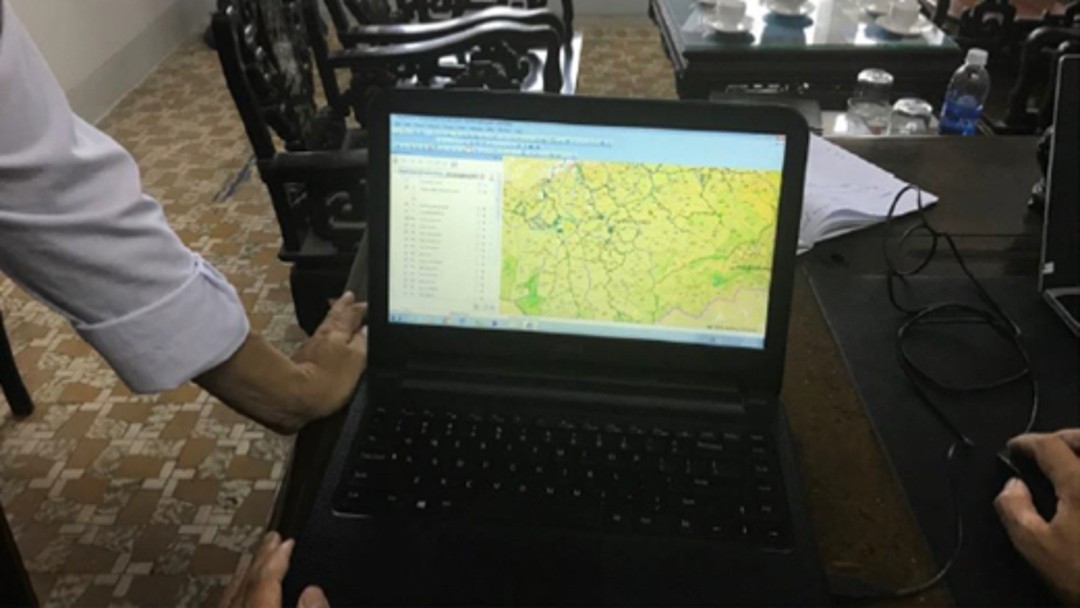
However, these sources provide only limited in-depth, quantitative information to assess the impacts and sustainability of a project. For this reason, further secondary data and new data sources, such as satellites, are being used on an increasing basis. These types of data can be a very useful source of supplementary information to enhance missing or inconsistent data during the project implementation phase and thereafter. These approaches showcased their strengths in the context of coronavirus pandemic travel restrictions, enabling work to continue on a remote basis. In addition to satellite data, there are a number of other new (and old) data sources and forms of analysis. Over recent years, recording and application of these sources has become significantly easier thanks to the following developments:
As a result, a quantitative, more data-driven analysis becomes much more feasible – even remotely. In some cases, this also makes rigorous evaluation approaches easier to implement. For example, satellite data can be used to record baseline information retrospectively, which improves the design of the evaluation. Combining traditional types of data with these new sources of data opens up new perspectives, increases the information content and improves the robustness of findings.
Brief description
The projects involved the reforestation and sustainable management of state-owned areas of forest containing local species used for long-term timber trees. The goal was to restore ecologically degraded areas, including their key ecological role, while also improving living conditions of the local population.
Result:
Household surveys revealed that water availability and quality had improved. Site visits confirmed these (subjective) appraisals to a great extent. A growing level of environmental awareness was also detected among the projects’ beneficiaries.
The reforestation measures completed during the project led to the desired growth in forest within the project areas. However, geodata analyses helped to detect forest loss in other parts of the municipal forests. In terms of area, forest loss exceeded growth. As a result, it became clear that, in addition to reforestation, land usage planning and controlled deforestation are also important to the sustainable recovery of ecosystems.
Special methodology: geodata analysis
A variety of instruments were used to measure forest losses in this evaluation. Information from Global Forest Watch (GFW) was used to analyse large-scale forest loss; to detect early stages of forest degradation (e.g. removal of individual trees), data from the ESA’s (Sentinel) mission for the Copernicus programme was evaluated with the help of the dNBR algorithm (delta Normalised Burn Ratio). Furthermore, forest loss and growth were classified on an object basis using Sentinel data. The Sentinel data combined with the dNBR algorithm proved to be a particularly precise method in this context.
All three methods suggest large-scale deforestation. The finding could be corroborated in comparing one method with one another. Quantifying forest growth and loss in this way would not have been possible without the use of satellite data for all project locations.
In some cases, the results from the geodata analysis even indicated deforestation trends that contradicted the findings from the local visits. For example, information provided by the official authorities pointed towards a clear decline in illegal logging. However, the analysis of satellite images revealed deforestation and forest clearance that went beyond the intended scope. Without analysis of satellite data, this development would have remained undetected.
This evaluation clearly shows how new sources of data – for example, satellite data – can effectively support the evaluation process. The availability of suitable data for the relevant indicators plays a decisive role here.
Brief description
The construction of power lines and rural electrification were part of reconstruction processes in Cambodia after the first democratic elections. The goal was firstly to improve the transmission of power from Takeo to the capital city of Phnom Penh and secondly to bring electricity to selected rural areas. The measures included the construction of an electricity line and of a new substation and power distribution system. The project’s overarching goal was to reduce poverty and improve social and ecological sustainability.
Result:
The measures led to significantly improved living conditions and simultaneously reduced the use of local diesel generators. Energy prices have fallen in rural and urban areas, and the measure continued to have positive effects after its completion.
Special feature of data sources
In addition to before-and-after comparisons and interviews in the field, secondary data was used to triangulate results for the evaluation of these projects. The secondary data included the project-executing agency’s annual report as well as the World Development Indicators.
Furthermore, it was possible to access household data collected in the region by the World Bank and use them for the evaluation. This evaluation revealed, for example, that the proportion of household expenditure spent on electricity costs was significantly lower in the project regions than in the rest of Cambodia.
The evaluation of this project shows that it is worth taking a broader view and that the collection and use of quantitative data from other donors improves the informative value of the evaluation.
Brief description
The multi-phase project supported smallholders in the regions to the east/south-east of Mount Kenya in the transition from rain-dependent farming to irrigated agriculture. In addition to increasing agricultural production, the main goal was to improve the living conditions of rural households. The project made use of existing organised groups and cooperatives and issued loans according to a group lending principle – 50% of the measures were financed from grants, while the remaining measures were covered by loans to groups of smallholders.
Result:
Thanks to the measures, it was possible to increase the area of irrigated farmland. According to household surveys, the option to use irrigation allowed for a diversification of agricultural products. As a result, the smallholders were able to better adapt their selected products to market demand and, in some cases, switch to cash crops, i.e. agricultural products with higher margins.
The project measures did not result in any significant change inbiomass production. This developed similarly in areas that were structurally comparable to the project regions but that were not targeted by the project.
However, the irrigation measures did have a positive impact on harvesting cycles. In the project regions, smallholders were able to plant and harvest crops more regularly than those in other areas with similar attributes. According to some of the smallholders in the target group, the project helped to make agricultural work their main source of employment and secure a constant stream of income.
Special feature of data sources
In addition to household surveys, the evaluation used multispectral satellite imagery and FAO WaPor 2.0 satellite data. This facilitated advanced analyses such as zonal statistics and the creation of visualisations of project areas and their characteristics.
The satellite data enabled the analysis of areas that were still in the implementation phase and without survey data. This made it possible to compare project areas from Phase III with structurally similar project areas from Phase IV, where irrigation has not yet been implemented. This approach enabled an impact measurement using a difference-in-difference approach.
The difference-in-difference analysis revealed that the project did not have a significant effect on biomass production in the project regions. It was only after the additional analysis of satellite images that a change to the harvesting cycle could be identified – and thus an additional positive impact of the project.
In this case, the use of new data sources complements traditional evaluation methods – and facilitates a more robust and extensive evaluation of the project impact.