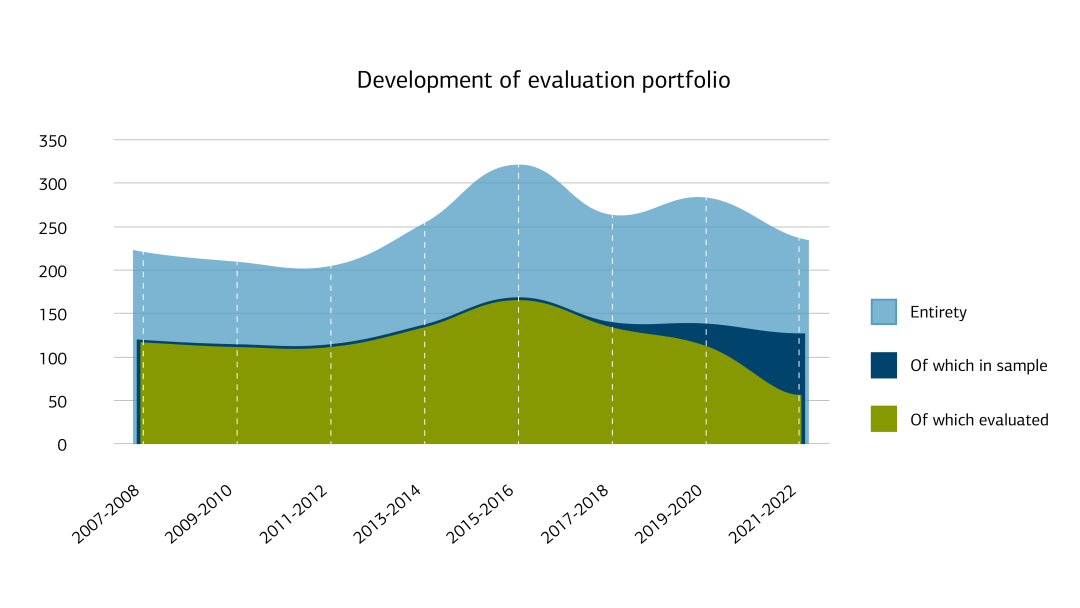
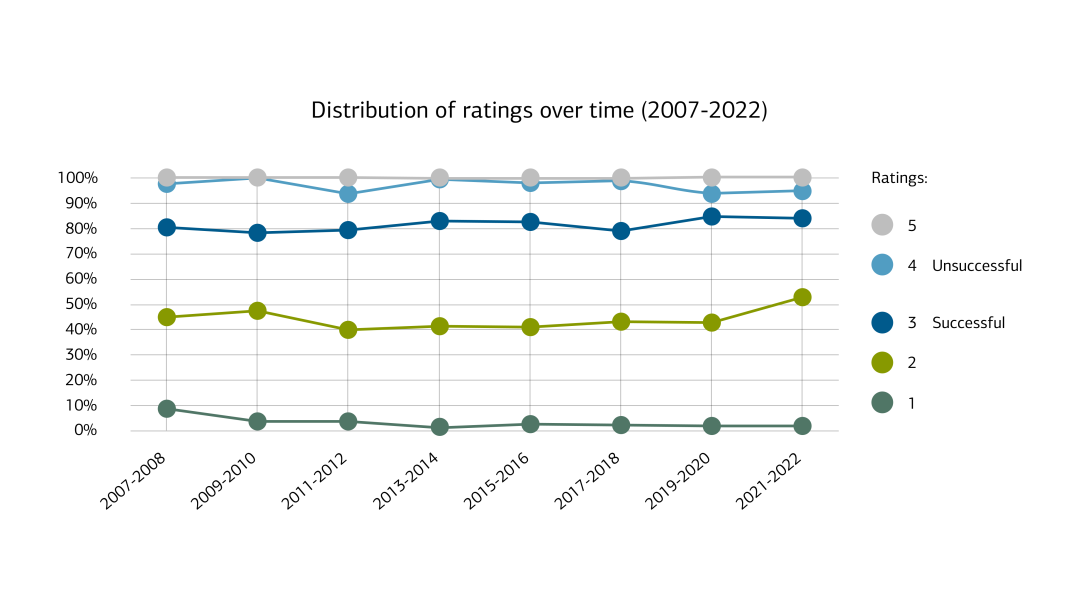
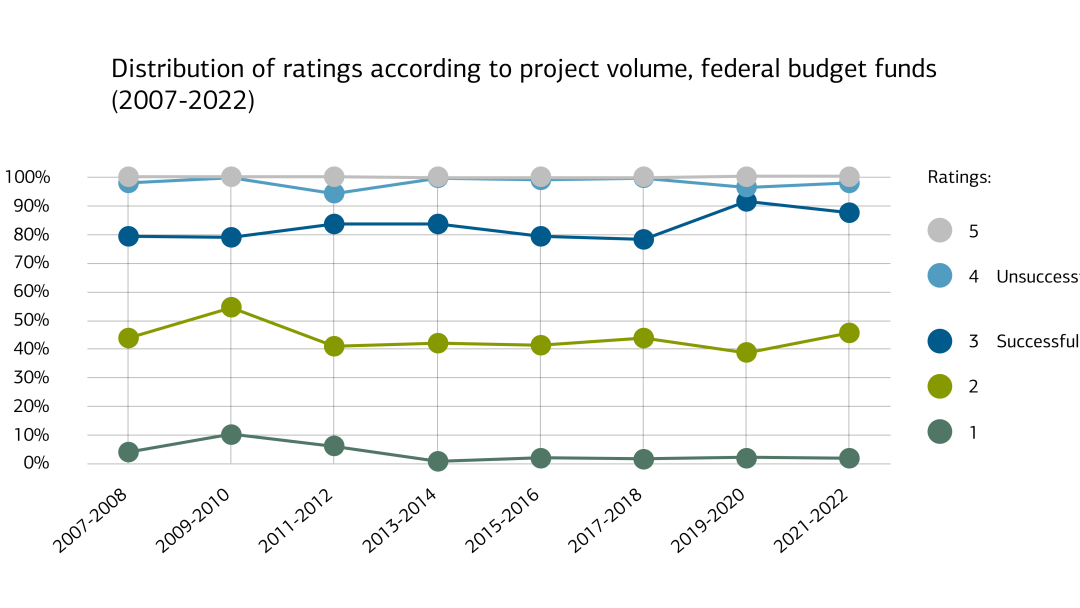
With 236 projects, the population of the two-year period 2021-2022 is in line with the long-term average. The success rate based on the projects evaluated to date from the representative sample 2021-2022 (overall rating of 3 or better) is 84%. This value is also roughly in line with the results of previous years.
1. Graph: Development of evaluation portfolio
This graph shows the number of the projects within the entirety (i.e, all projects ready for evaluation) for each of the two-year intervals since 2007. The size of this entirety varies over the years, with a low point of 206 projects for the years 2011-2012 and a maximum of 328 for the years 2015 and 2016. The graph also shows the size of the representative sample, which is usually approximates half of the entirety. The third data row shows the number of projects within each sample that have been evaluated to this date. The values for each two-year period are:
2007-2008: 224 projects, thereof 117 projects included in the representative sample and thereof 116 projects evaluated to this date.
2009-2010: 212 projects, thereof 111 projects included in the representative sample and thereof 110 projects evaluated to this date.
2011-2012: 206 projects, thereof 112 projects included in the representative sample and thereofr 111 projects evaluated to this date.
2013-2014: 256 projects, thereof 135 projects included in the representative sample and thereof 133 projects evaluated to this date.
2015-2016: 328 projects, thereof 166 projects included in the representative sample and thereof 164 projects evaluated to this date.
2017-2018: 304 projects, thereof 159 projects included in the representative sample and thereof 154 projects evaluated to this date.
2019-2020: 285 projects, thereof 136 projects included in the representative sample and thereof 111 projects evaluated to this date.
2021-2022: 236 projects, thereof 124 projects included in the representative sample and thereof 55 projects evaluated to this date.
2. Graph: Distribution of ratings over time (2007-2022)
This graph shows the distribution of the total number of evaluated projects to the total ratings (from 1 to 6) achieved. All projects with a rating from 1 to 3 are considered successful. The graph looks at the period between 2007 and 2022 and shows that the distribution has remained relatively stable during this time. For the 2021-2022 period the cumulated distribution is as follows:
2% of all projects have achieved a rating of 1
53% of all projects have achieved a rating of 2 or better
84% of all projects have achieved a rating of 3 or better
95% of all projects have achieved a rating of 4 or better and
100% of all projects have achieved a rating of 5 or better
3. Graph: Distribution of ratings according to project volume, federal budget funds (2007-2022)
This graph shows how the total federal budget funds of evaluated projects are distributed among the achieved results. It looks at the period between 2007 and 2022 and reveals that this distribution has remained relatively stable during this time. For the 2021-2022 period the cumulated distribution is as follows:
2% of the budget fund volume went to projects that have achieved a rating of 1
46% of the budget fund volume went to projects that have achieved a rating of 2 or better
88% of the budget fund volume went to projects that have achieved a rating of 3 or better
98% of the budget fund volume went to projects that have achieved a rating of 4 or better and
100% of the budget fund volume went to projects that have achieved a rating of 5 or better
4. Graph: Estimated success rate and 95% confidence interval
This graph describes the estimated success rate including the respective confidence interval (95%) for the two-year intervals since 2007. For all two-year intervals between 2007 and 2020 the two-sided confidence interval was constantly near plus/minus 5% Only for the most recent interval 2021-2022 the confidence interval is significantly higher at plus/minus 9%, which is due to the fact that this estimate - for now - is based on fewer observations i.e. completed evaluations. The average success rate estimates for the respective two-year-intervals are:
2007-2008: 81%
2009-2010: 78%
2011-2012: 79%
2013-2014: 83%
2015-2016: 82%
2017-2018: 79%
2019-2020: 85% and
2021-2022: 84%.
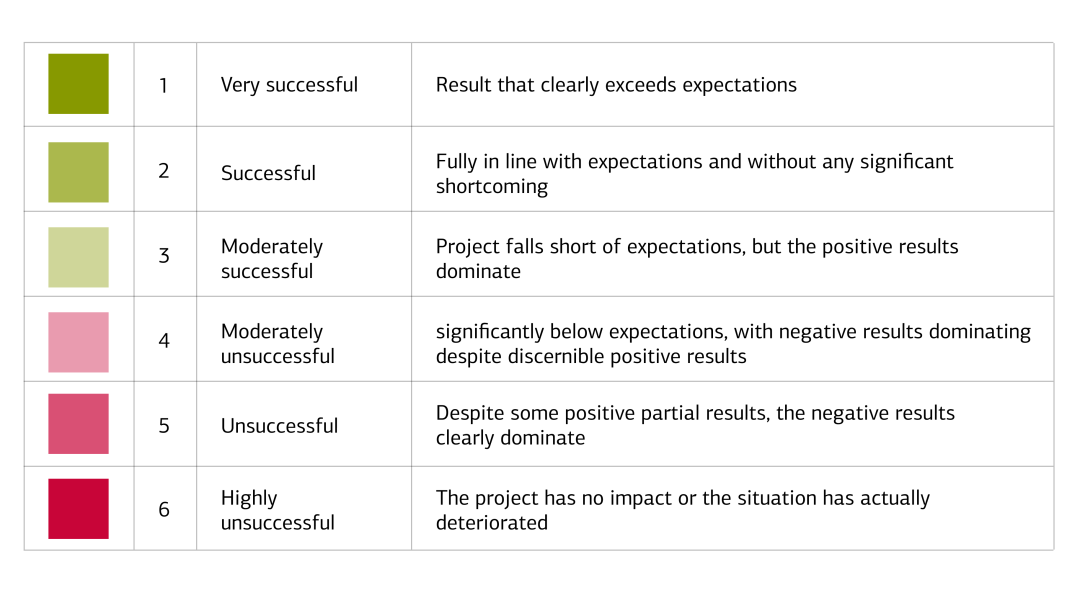
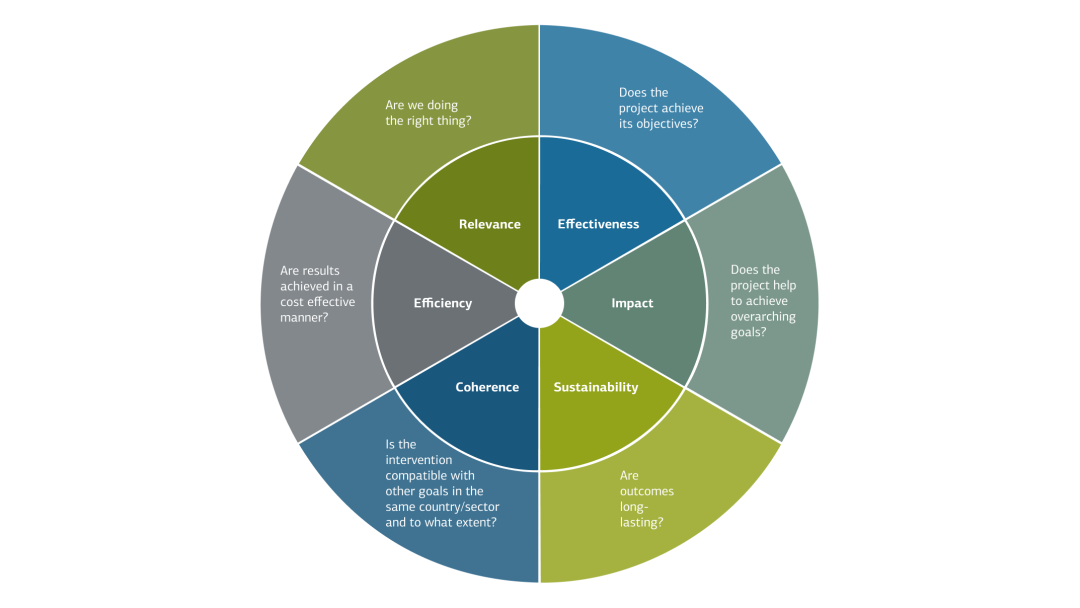
The projects are evaluated according to six DAC criteria. In doing so, we follow the evaluation guidelines of the Federal Ministry for Economic Cooperation and Development (BMZ). In concrete terms, this means that we consider each criterion and assign them a specific grade for it. For the criteria of effectiveness, impact, and sustainability, ratings lower than "3 = limited success" mean that the project can no longer be rated as successful. On this basis, and taking into account the context, we determine the appropriate overall evaluation rating. This overall rating therefore does not have to coincide with the average of the separate ratings for each criterion.
In 2021 and 2022, 152 ex-post evaluations were conducted. Of these, 122 projects were included in a sample and are used to estimate the success rate. Fifty projects are from the 2021-2022 sample, while the remaining 72 projects are taken from samples of previous years. In addition, there are five projects from the 2021-2022 sample that were evaluated at an earlier point in time.
Around half (51%) of the projects achieved a success rating of 2 (successful), while around a third (31%) achieved an overall result of 3 (limited success). A total of nine projects were rated unsuccessful with an overall score of 4 or 5. Only one project (Bosnia-Herzegovina: Mesihovina wind farm) achieved an overall rating of 1 (very successful).
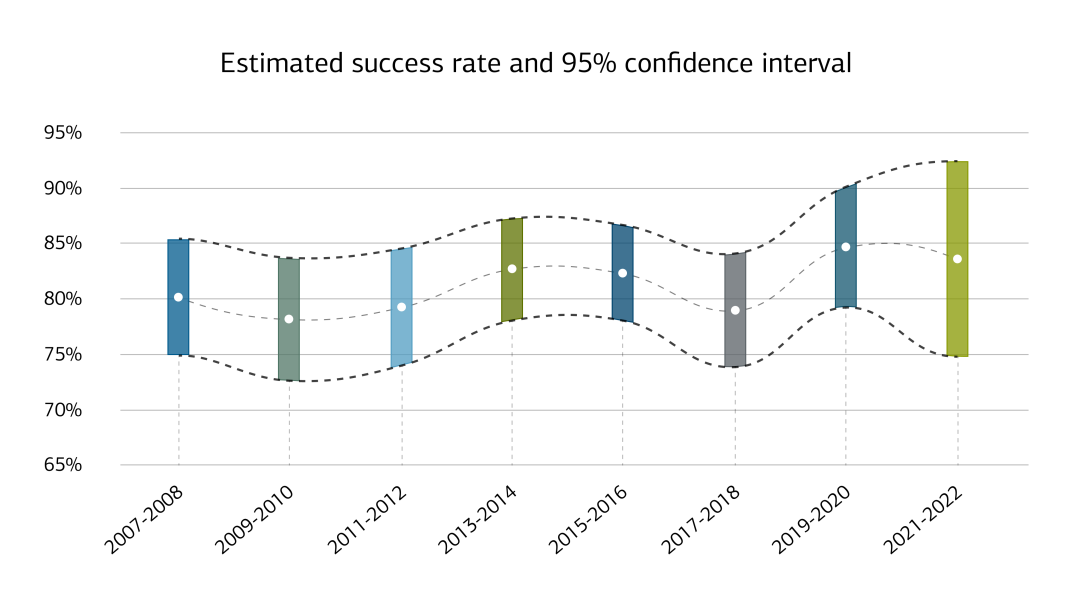
With the above-mentioned success rate of 84%, this value lies at the same level as in previous years. However, only 44% of the projects from the 2021-22 sample have been evaluated to date. Accordingly, the success rate estimate for the 2021-22 population has not yet been finalized. Nonetheless, it can already be inferred that the success rate will range between 75% and 92% with 95% confidence for the 2021-22 population. This observation is consistent with the analyses of the last years and is in line with the general, slightly positive trend over the last 16 years.
Projects are analysed on the basis of six key criteria agreed upon by the international community of donors as represented by the Development Assistance Committee (DAC) of the Organisation for Economic Cooperation and Development (OECD). The rating is summarised using a numerical scale.
1. Graph: OECD-DAC Criteria
The graph shows the 6 evaluation criteria (relevance, coherence, effectiveness, efficiency, impact and sustainability) as well as the question of how to approach each criterion. Issues include
Relevance - are we doing the right thing?
Coherence - Is the intervention compatible with other interventions and political goals?
Effectiveness - do the project achieve its objectives?
Efficiency - Are the results achieved in a cost effective manner?
Impact - Does the project help to achieve overarching goals?
Sustainability - Are outcomes long-lasting?
2. Graph: Rating scale
The graph on the score scale shows a 6-step rating of very successful (rating scale 1), successful (rating scale 2), limited success (rating scale 3), rather unsuccessful (rating scale 4), mostly unsuccessful (rating scale 5) and completely unsuccessful (rating scale 6).
Rating scale 1: very successful, result that clearly exceeds expectations
Rating scale 2: successful: fully in line with expectations and without any shortcoming
Rating scale 3: moderately successful: project falls short of expectations, but the positive results dominate
Rating scale 4: moderately unsuccessful, significantly below expectations, with negative results dominating despite discernible positive results
Rating scale 5: unsuccessful: despite some positive partial results, the negative results clearly dominate
Rating scale 6: highly unsuccessful: the project has no impact or the situation has actually deteriorated